Skip to Content
 

Balancing stock market risk and reward

22 replies [Last post]
larienna
larienna's picture
Offline
Joined: 07/28/2008

OK, I tested my recent changes and the game simulation worked successfully for one of my objectives. The objective would be to have 4 different strategies based on 2 axis:

Buy low sell high VS buy smart: This is the newbie strategy VS the expert strategy.

Concentrated Shares VS Diversified shares: This is the high risk VS low risk strategy.

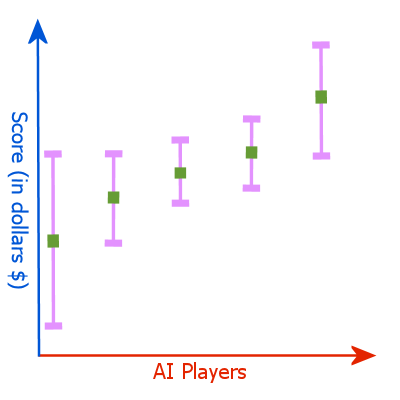
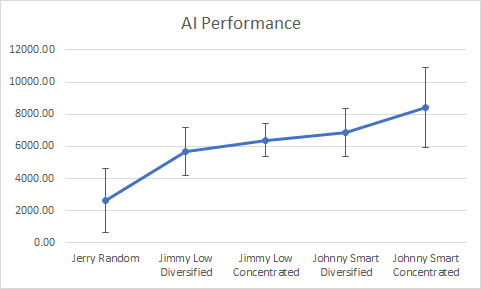
Now I have 5 AI, one for each Strategy plus one doing random actions. Here is the simulation results for 10000 games:

Statistics compilation for each player
Player:Jerry Random 2623.1904
Player:Jimmy Low concentrated 6396.16
Player:Jimmy Low diversified 5695.8193
Player:Johnny Smart concentrated 8434.502
Player:Johnny Smart diversified 6877.638

What is new is that with recent rule changes, the smart AI can now surpass the Buy low AI. So an expert player is rewarded for it's extra efforts.

Now I see that the concentrated AI have better average score than diversified strategies. Does that makes them superior?

The objective is to have high risk, high reward. You can lose a lot, but you can also win a lot. Unless I am mistaken, having more risk would change the distribution on the curve (variant) but the average would remain the same.

Since concentrated AI have an average way higher than diversified strategy, that would be that the game is broken. Concentration is always superior and worth the risk.

I imagine I would need to change additional rules to make sure the concentrated and diversified AI average fortune are equal. Unless there is something I missing. Maybe the psychological effect of playing more risky, will incite players not to do that.

What are your thoughts?

Fri
Offline
Joined: 09/06/2017
Maybe earnings are skewed by a few high earners

Good work setting up all this testing for your game. I am assuming that these numbers represent the average earnings for each player. If this is true the major concern that I would have is that, a small percentage of high earners are skewing your average of smart concentrated. To put it another way, when it works, it works really well, but most of the time it doesn't work. (As a concrete example 1/5 times this strategy earns 40,000 but the rest of the time it earns close to 0.) This would have two potential ramifications on game play. One is this strategy would have a lower winning percentage. Second if it it is working really well it would maybe unsurmountable by the other players, well before the the game should be over. Can you look at the number of wins for each strategy?

Good luck with your game.

X3M
X3M's picture
Offline
Joined: 10/28/2013
Don't just look at the average

When I had testing done. I didn't just look at the average result. But also the number of wins and losses.

There are also several ways to look at the results in how much you won or lost.

If going to 0 means -100%. Then the best way to look at the other numbers, is also in %.

Now, I see, 2000 and 6000 and 8000. But what did you start with? Was it 1000? Then you got x2, x6 and x8. That is different than +100%, +500% and +700%.

Was it 4000?
You got yourself -50%, +50% and +100%.
See how fast things shift in regards to the results?

***

Also, the average doesn't mean much, if the bottom is 0.
Since if you have a high win high reward as goal.
All strategies should yield the same average end result IN WINNING OR LOSING.

Yet, the strategies that lose a lot, end up with 0 a lot. And the few winning value's will take that average to an average by being very high. In the end, it doesn't matter, right?

Please observe the following end results:

A; 1+1+1+1 averages to 1.
B; 4+0+0+0 averages to 1.
C; 2+2+0+0 averages to 1.

A has a 75% chance of winning over B.
A has a 50% chance of winning over C.
B has a 25% chance of winning over A.
B has a 25% chance of winning over C.
C has a 38% chance of winning over A.
C has a 50% chance of winning over B.

The high risk high reward will end up losing the most here.
If the end result is part of who wins the game. Then you need to look at the end result and count which strategy wins the most.

questccg
questccg's picture
Online
Joined: 04/16/2011
I propose that something is MISSING

I see you have different Players with different Investment Strategies and then the result of those strategies in comparison with EACH OTHER. But I would propose that "something" is missing...

What I mean is that while the AMOUNTS are reasonable, the PERIOD for these amounts is just as important and missing.

Like Johnny Smart concentrated got the HIGHEST AMOUNT (8434.502). But what concerns me most is the TIME for this amount to be accumulated. See while Johnny Smart diversified got 6877.638 which is lower than the other strategy, what is of more importance is how many TURNS or TIME (Days, Months, Years) was this amount accumulated. If it's 5 Days ... Well then that's maybe a bit worrisome because it doesn't feel NATURAL even for Day Traders who spend all their time buying low and selling high.

But if these amount are like over 2 Months or 60 Days ... Well then those amounts seem more REASONABLE and could work in terms of the game (IMHO).

I know you say this is the average over 10,000 games... So those are END-GAME results averaged out??? It still doesn't tell me what the PERIOD of play is and how further apart the scores will be if there are LONGER or SHORTER games (in some kind of duration/time).

Now my critique in terms of the RESULTS you offer and propose.

Diversified portfolios tend to average out better and over a PERIOD of time (that's what is missing TBH) offer better returns. Concentrated portfolios can win big SOMETIMES and underperform MOST OF THE TIME. It depends on the nature of the investments also. Clearly if this is like Mutual Funds the Energy Funds are more risky but sometimes you can do better (not like I ever made any of my monies doing this...) The idea is that on AVERAGE a fund has diversified shares in various assets performs more AVERAGE too.

So I don't think the game is broken.

I think Concentration usually leads to a higher pay-off, let's say Energy Stocks (for example) which are higher risk tend to pay-off more if there is no recession or some other form of lack luster performance.

BUT... If that were the CASE, everyone would buy into Energy Stocks and that type of investment would become super saturated AND THEN ... The AVERAGE return with regards to profitability would DECREASE...

That's another ASPECT: HOW SATURATED is the market for a type of stock.

The more people buy, the less everyone gets generally speaking. Sure some of the stocks hold some of their value, some may even increase... But I would say that when this happens people with NON-COMMON shares in those companies or stocks would sell some of their PRIVILIEGED shares in order to transform shares into ACTUAL EARNINGS. And at that point in time, the value of the stock will obviously decrease and that's how everyone in the common share pool make LESS monies.

Anyways... I don't get the impression that the game is broken. I think it's spot on. But I would suggest PERIODS/TIME and MARKET SATURATION to further AFFECT the efficiency of trading stocks.

Add those two (2) variables into your game and maybe you can simulate the market a bit more accurately knowing how "reasonable" the earnings are with the overall PERIOD/TIME and figure out SATURATION (could be tougher than TIME) and see how insider trading could influence stocks that INCREASE TOO MUCH... Because then we all know people on the Board of Directors would definitely SELL some of their shares to gain more monies and the overall VALUE of the shares will then on average GO DOWN for most people investing in the stock.

Those are my thoughts. Cheers!

larienna
larienna's picture
Offline
Joined: 07/28/2008
Thanks for the output, you

Thanks for the output, you bring interesting points.

Starting money is 500$

Duration is 10 years, composed of 4 turns, so 40 turns. So the value above is average amount of fortune at the end of the 10 year period.

I think that dressing up a curve of the fortune could be something to consider. Maybe some of the players does not have a normal distribution. I could try to distribute the values on a graph.

Comparing winnings and loosings, interesting. I would not be able to put multiple copies of the same AI, at least for the buy low, because the evaluation of the stock (which stock it buy) would always be the same. For the smart AI, I am using Multi Criteria Decision Analysis algorithm, I can give various ponderations that have similar performance, which could lead to players building up different portfolio.

questccg
questccg's picture
Online
Joined: 04/16/2011
What could be of use is...

The "Standard Deviation" along with the Average. Why? Because the Average just tells us which AI Player ON AVERAGE does in the Trading of stocks. The "Standard Deviation" tells use the LOWS and HIGHS for each AVERAGE.

So if "Johnny Smart concentrated 8434.502" has a deviation of let's say 1500.00 that means that when you plot the graph "8434.502" is the point and +/- 1500.00 means that the AI Player gets 6934.502 (on the LOW) and 9934.503 (on the HIGH).

Again WHY(?) is this important... You may be wondering. Let me continue with more data and then it will become more apparent to what I am reaching for...

Next if "Johnny Smart diversified 6877.638" has a deviation of 2000.00 that means that his deviation is 4877.638 (on the LOW) and "8877.638" (on the HIGH).

Okay where am I going with all of this...?

Well if concentrated does RELATIVE POOR (7200.00) and diversified does RELATIVELY GOOD (8000.00)... You see that the DIVERSIFIED portfolio does BETTER than the CONCENTRATED one...!

I think this is the INFORMATION you are MISSING to get a better understand on the performance of the various portfolio and investment strategies: their Standard Deviation!

This will reveal how EFFECTIVE the strategies are... PLUS they will show if some of the performances of SOME of the portfolios are more COMPETETIVE that just whatever the AVERAGE is telling you.

Best.

Note #1: Here's what I mean in a RUDIMENTARY way in this sample graph I put together in Paintshop Pro.

And then you can SEE if your game is "broken" or not. What do I mean??? Well if the game doesn't allow the diversified AI players to be within REACH of the the concentrated AI players (in deviation), well then MAYBE(?) you might have an issue. This will be the ultimate "litmus" test to see if the game allows players to encroach and have a good vs. bad game and not always the AVERAGE.

That's something else. How GOOD or how BAD you get as results will also help determine how playable the AI Players are in comparison to each other and also it can help determine how a PLAYER (Human) can possibly stack up to the AI opponents.

Note #2: I know that looks like a primitive graph (and it is) but it conveys one important issue:

Is a BAD concentrated Game within REACH of an AVERAGE diversified Game?

That is the KEY to that graph (the take-away that is important)...

Note #3: Also the other take-away is if the "Low diversified" at 5695.8193 is within reachable range of the Smart Opponents... That also is something to check (again by determining the Standard Deviation).

P.S.: I would really like if you could SHARE with US the results of this exercise (determining the STD DEV) and plotting a graph (similar to my own...) but maybe from Excel or something (screenshot) whatever works. It doesn't need to be FANCY ... Just showing the differences between each AI player.

Note #4: I'm not saying my "sample" graph is realistic or not ... Actually if the results are close to this... Then maybe the game is NOT broken. By my own analysis the Random AI Player scores the lowest but has a higher Standard Deviation. Therefore that AI Player is near the bottom and the Standard Deviation is sufficiently "high" enough to reach the BAD of the "Smart Concentrated" AI Player (lowest or lower range).

So my graph isn't the worst possible outcome and is a sample of a reasonably FAIR game in that the Random player can have a HIGH Standard Deviation (Positive) and be within reach of the lower-end of the Smart Concentrated AI Player. That's MY sample Graph... Still YOURS may look different and may NOT be broken also.

Cheers!

questccg
questccg's picture
Online
Joined: 04/16/2011
Here's a SAMPLE in Excel

Click HERE if you want the Excel file.

Really SIMPLE TBH. The only tricky part was the "Error Bars" but once I Googled for how to ADD error bars, the rest was pretty much self-explanatory.

The Standard Deviations are SAMPLES only: 2000, 1500, 1000, 1500 and 2500.

But this looks like a pretty DECENT Graph with COOL Standard Deviation that would make for a pretty BALANCED game (even with the higher performing AI Players).

Sincerely.

Note #1: The only FLAW to this graph... Is the Random Player which really doesn't compare or stack-up with any of the other AI Players even with a HIGH Standard Deviation of 2000.00. So odds-wise this AI Player doesn't stand a chance at beating ANY of the other AI Players (there is a small chance on the higher end but the odds are against it for the more habitual scoring).

larienna
larienna's picture
Offline
Joined: 07/28/2008
Yes, standard deviation

Yes, standard deviation visualized as you mentioned could be used to know if some strategies overlap. I can easily make the program output all game data as CSV and then import it in excel to make the curve.

Another AI I could try is one that buys everything, therefore becomes the market. This would determine if there is an interest in making choices in order to win the game. The random AI is the proof that making illogical choices will not bring you a victory.

questccg
questccg's picture
Online
Joined: 04/16/2011
Also ...

larienna wrote:
Yes, standard deviation visualized as you mentioned could be used to know if some strategies overlap. I can easily make the program output all game data as CSV and then import it in excel to make the curve.

Exactly. You are so very right.

larienna wrote:
Another AI I could try is one that buys everything, therefore becomes the market. This would determine if there is an interest in making choices in order to win the game.

But don't you need to MANAGE "money"??? Like "buys everything" would mean an unlimited budget which is not the case if everyone starts off with ONLY $500. This would boil down to the RANDOM Jerry who randomly buys according to HOW MUCH money he has to invest, no???

larienna wrote:
The random AI is the proof that making illogical choices will not bring you a victory.

Makes sense.

larienna
larienna's picture
Offline
Joined: 07/28/2008
Quote:But don't you need to

Quote:
But don't you need to MANAGE "money"???

I mean more buy stocks evenly. Make sure you have an almost even value of stock for each type.

larienna
larienna's picture
Offline
Joined: 07/28/2008
I managed to compare fortune

I managed to compare fortune for victories. Here are the results:

The victory rank reads as a number of times a player scored rank X. So for example, the Random AI finished first 212 games out of 10000. Which is pretty surprising. Then finished second place 460 games, third place 1190 games, etc.

Statistics compilation for each player
Player:Jerry Random 2628.9712
Victory rank : [5387, 2751, 1190, 460, 212]
Player:Jimmy Low concentrated 6242.2217
Victory rank : [3375, 2244, 1270, 1125, 1986]
Player:Jimmy Low diversified 5731.047
Victory rank : [389, 2306, 3616, 2283, 1406]
Player:Johnny Smart concentrated 8459.522
Victory rank : [711, 1490, 1682, 2328, 3789]
Player:Johnny Smart diversified 6893.625
Victory rank : [135, 1208, 2245, 3805, 2607]

From a quick look, the fortune average is very close to the distribution of the first place rank. The most performant AI is Smart+Concentrated for both fortune average and victories.

One deduction I could make is that concentrating on smart AI is not that much of a risk. From 1% to 7% failure (last place). But concentrating for a buy low AI is super risky. From 3% to 33% failure.

There might be other behavior to extract from this.

larienna
larienna's picture
Offline
Joined: 07/28/2008
Here is another run with the

Here is another run with the addition of Standard Deviation

Statistics compilation for each player
Player:Jerry Random: AVG: 2591.52  SD: 1852.18
Victory rank : [5407, 2755, 1230, 423, 185]
Player:Jimmy Low concentrated: AVG: 6087.79  SD: 8474.18
Victory rank : [3351, 2382, 1290, 1074, 1903]
Player:Jimmy Low diversified: AVG: 5696.03  SD: 3897.52
Victory rank : [378, 2298, 3521, 2353, 1450]
Player:Johnny Smart concentrated: AVG: 8446.34  SD: 7386.34
Victory rank : [711, 1442, 1672, 2323, 3852]
Player:Johnny Smart diversified: AVG: 6897.82  SD: 3730.13
Victory rank : [149, 1122, 2290, 3827, 2612]

Hmmm!, numbers looks weird, there could be an error. Maybe there is an overflow of miss calculation since SD cannot be greater than AVG.

X3M
X3M's picture
Offline
Joined: 10/28/2013
Hmmm! indeed

larienna wrote:
Hmmm!, numbers looks weird, there could be an error. Maybe there is an overflow of miss calculation since SD cannot be greater than AVG.

Sure it can.

Most common reason would be negative numbers.

Or, if you have a lot of results ending in 0. Then one time a big number. Far above the AVG.
https://anydice.com/program/2cc31

questccg
questccg's picture
Online
Joined: 04/16/2011
Are you sure you computed the Standard Deviation correctly???

The reason I ask... Because it means that the scores are WILDLY "different". And because of this... I feel like the computation may be incorrect. In mean if the average is 5696.03 and the SD is 3897.52 indicates that the game scores are fluctuating a LOT. Which makes me wonder if the correct MATH was applied to compute the SD.

Here's an example with 5 values:

Mean is 73.0, SD is 26.86

Explanation:

Data set : {82, 44, 67, 52, 120}

Mean is the average of Data set:

M = 82 + 44 + 67 + 52 + 120 = 365 / 5 = 73.0

Standard deviation is square root of variance (σ^2), SD = √(σ^2)

Variance is The average of the squared differences from the Mean.

σ^2 = ((82 − 73)^2 + (44 − 73)^2 + (67 − 73)^2 + 
       (52 − 73)^2 + (120 − 73)^2) / 5

or

σ^2 = (81 + 841 + 36 + 441 + 2209) / 5 = (3608 / 5) = 721.6

SD = √(σ^2) = √721.6 ~= 26.86

Mean is 73.0, standard deviation is 26.86 [Ans]
questccg
questccg's picture
Online
Joined: 04/16/2011
To compute it is very easy on-the-fly (much like the Average)

SUM (Score[0] to Score[9999]) / 10000 = Average or Mean.

To compute this in software just have:

M_Total += Score[i] where i = 0 to 9999.
At the very end M_Total / 10000 = Average or Mean.

The squared variance is also easy:

V_Total += (Score[i] - Average)^2 where i = 0 to 9999.
At the very end V_Total / 10000 = Variance

SD = SQRT(Variance)

Should be easy to compute... Check if you have the correct formula.

Cheers!

larienna
larienna's picture
Offline
Joined: 07/28/2008
It's more a computer logistic

It's more a computer logistic problem. The "Classic" variant formula requires to have the average for each element to computer. That would require saving the results in memory and then making the computations since I cannot know the average before completing all the tests.

I have another formula I cannot find on the net but used in my stat class that sum up all the data then subtract the average. This is what I am using:

sum(fortune^2)- n * average^2 / n-1

Else I am thinking to output the results in text, import it in excel then make computations there.

To give an idea, I think it was the SmartConcentrated AI, the min was 1000$ and max was 34000$

larienna
larienna's picture
Offline
Joined: 07/28/2008
After making some computation

After making some computation in excel, it seems that the standard deviation is exact. My data set seems to have extreme values. Here is the graph of the frequency by splitting the max fortune in 100 equal parts.

https://boardgamegeek.com/image/7257382/larienna

I decided to only use the left 15% of the chart that goes from approximately 0 to 20000$, here is the results:

https://boardgamegeek.com/image/7257383/larienna

The curves are pretty complex and it hard to analyze which strategy is better.

I might try doing the same thing with the previous rules because maybe the game was already balanced before the last modification.

X3M
X3M's picture
Offline
Joined: 10/28/2013
Practical balance

Please make sure you keep an eye on practical balance.

Thus if the players know that a certain strategy will never result in what they need. Then that strategy is never going to be used.
And thus, a strategy that has 0% chance in succeeding, needs a buff until it does.

Then again, you are only doing this for the ai. Right?

larienna
larienna's picture
Offline
Joined: 07/28/2008
The AI is used to see if

The AI is used to see if different strategies are viable. The players are free to design their own hybrid strategies. Yes, I could reuse the AI for a digital implementation.

X3M
X3M's picture
Offline
Joined: 10/28/2013
larienna wrote:The AI is used

larienna wrote:
The AI is used to see if different strategies are viable. The players are free to design their own hybrid strategies. Yes, I could reuse the AI for a digital implementation.

Ah, since the AI is only to test the strategies.

What is your goal?
Do you want each strategy to be roughly giving the same chance to win?
Or do you want each strategy to have at least a, for example, 5% winchance?

larienna
larienna's picture
Offline
Joined: 07/28/2008
The goal are: A: Make the

The goal are:

A: Make the Smart strategies give more chances to win, but they are more complicated to pull off than the buy low strategy.

B: Make the concentrated strategies more risky, but maybe have better payout to compensate for it. On BGG, somebody said that the victory results is more important than the fortune value.

Right now, the concentrated smart strategy give the most victories.

Is it a dominant strategy?

Should all strategies have an equal amount of victories?

Or maybe it's balanced because smart + concentrated strategies requires more effort and more risks.

X3M
X3M's picture
Offline
Joined: 10/28/2013
larienna wrote:The goal

larienna wrote:
The goal are:

A: Make the Smart strategies give more chances to win, but they are more complicated to pull off than the buy low strategy.

B: Make the concentrated strategies more risky, but maybe have better payout to compensate for it. On BGG, somebody said that the victory results is more important than the fortune value.

Right now, the concentrated smart strategy give the most victories.

Is it a dominant strategy?

Should all strategies have an equal amount of victories?

Or maybe it's balanced because smart + concentrated strategies requires more effort and more risks.


Well, he is right when it comes to victories.
I too went to balance until I had a close to 50-50 winchanve in certain situations.

In regards to chances to win.
Of course you could try to get close to equal chances. It will be hard. Then again, you always have the same starting conditions, right? But seeing as how you have more than 2 strategies here. I suggest you slowly adjust the lowest victory chance. Eventually, another will be lowest.
Do this until you are switching between 4 out of the 5. Once the 5th is the lowest, ypu can decide to keep that, or make 1 or 2 steps backwards.
I think you can get it between 15 and 25 percent.

Of course, combining strategies will yield better results for the player. But this is something you only look at for fun. And only this really depends on the fortune after a strategy.

High risk high reward is a great start for a low risk strategy afterwards. After all, once you are position 1. You want to keep it and not gamble away.

larienna
larienna's picture
Offline
Joined: 07/28/2008
The strategies are organized

The strategies are organized on 2 axis, or if you prefer on a 2x2 grid. So there is 2 criteria to consider A) Buy low vs smart (Newbie VS Expert) and B)Buy concentrated VS diversified (high vs low risk)

Syndicate content


forum | by Dr. Radut